PG Tools
Installation
If Docker is installed on your machine, run the following:
$ alias pg2dot='docker run --rm -v $PWD:/work g2glab/pg:0.3.4 pg2dot'
$ pg2dot --version
0.3.4
Otherwise, install Git and Node, then run the following:
$ git clone -b vx.x.x https://github.com/g2glab/pg.git
$ cd pg
$ npm install
$ npm link
$ pg2dot --version
0.3.4
Quick start
Create some sample data:
$ vi data.pg
data.pg
p1 :person name:Bob
p2 :person name:Alice
p1 -> p2 :likes  since:2013
p1 -- p2 :friend since:2011
Run the pg2dot command as an example:
$ pg2dot data.pg data
"data.dot" has been created.
data.dot
digraph "data" {
  "p1" [label="person\lp1\l" name="Bob"]
  "p2" [label="person\lp2\l" name="Alice"]
  "p1" -> "p2" [label="likes\l" since="2013"]
  "p1" -> "p2" [label="friend\l" since="2011" dir=none]
}
You can now generate a PNG image from the converted file using graphviz.
$ dot -T png data.dot -o data.png
data.png
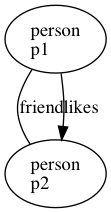 data
data
PG Tools commands
$ pg2dot <input_pg_file> <output_path_prefix>
$ pg2pgx <input_pg_file> <output_path_prefix>
$ pg2neo <input_pg_file> <output_path_prefix>
$ pg2aws <input_pg_file> <output_path_prefix>